The most exciting outfield plays in baseball are the ones where the fielder makes an incredible diving catch. It brings the fans to their feet. It makes the broadcasters scream. It's the kind of play that dominates social media and every highlight reel. They're exciting, and they're fun.
But our love of the dive sometimes obscures the more subtle great plays, the kind of play where an outfielder does so many things so well that he doesn't even need to dive. He just gets there. Those are great plays, too. They're just a lot harder to appreciate.
Atlanta's Ender Inciarte is a perfect case. He tied for first in Outs Above Average in 2016 (+21), tied for second in 2017 (+20) and was second again in 2018 (+21). He has been, by any definition, an elite defensive outfielder. But unlike fellow defensive greats like Byron Buxton or Billy Hamilton, Inciarte doesn't show up making insane diving catches, and he doesn't have elite speed. In 2018, for example, his Sprint Speed of 27.9 feet per second was somewhat above the Major League average of 27.0 feet per second, but was only in the 72nd percentile overall and was in the bottom third of center fielders.
If pure raw speed isn't Inciarte's elite skill, surely something else is. He gave us a hint when he spoke to Muscle & Fitness magazine before last season.
“I work a lot on my first jump step, which I think is the most important part for any outfielder. I work on my reaction time and quickness. It’s my goal to always get to the ball while standing, and not with a diving catch."
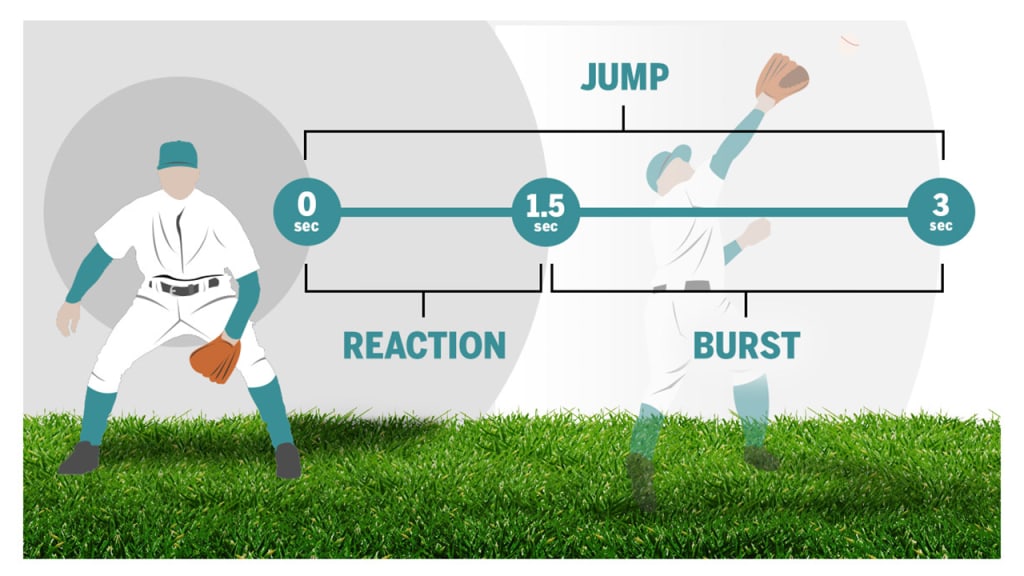
That's exactly right, and he usually does. But until now, we haven't had a great way to measure that. Maybe now we do, with the introduction of the new Statcast metric, "Jump," which helps us measure how quickly an outfielder gets moving toward the ball, often before a full sprint is even required.
It's defined as "How many feet did he cover in the right direction in the first three seconds after pitch release?"
We can show that both in raw numbers, and more importantly, vs. the Major League average. ("Average" being slightly different for each play, as each type of play has its own slightly different baseline, based on running back or not, near the wall or not and the length of time the ball is in the air.)
For example, here's Inciarte making a nice but otherwise not-terribly-notable-looking play to take a hit away from Manny Machado earlier this year. That undersells how hard it was; with a 30% Catch Probability, other opportunities with similar requirements (51 feet away, with 3.4 seconds of opportunity time to get there) drop 70% percent of the time.
Inciarte covered 43 feet in the first three seconds, which gives him a jump of +8.2 feet above average for that play.
If it doesn't "look hard," well, that's the entire point.
Compare that to a nearly identical play from late 2017, when Andrew McCutchen, faced with a similar 30% Catch Probability play, requiring 54 feet in 3.5 seconds in the same direction, dives and fails to make the play. It wasn't about speed, because Inciarte's Sprint Speed of 25.2 feet per second was actually slower than McCutchen's 25.7. It was about the jump.
Inciarte covered 8.2 feet more than league average in the first three seconds, while McCutchen covered only 2.3 feet more. That's a difference of six feet, and that is a huge deal.
Or, take a recent fantastic play, this one with a 35% Catch Probability, from Toronto's Jonathan Davis. That alone tells you a story, because similar chances aren't made two-thirds of the time. But it looked so good, so how come that number isn't lower?
It's because Davis, as great as he made that look, had a poor jump. He was actually 0.4 feet below average in the first three seconds, meaning he got off to a slow start. But because of his strong speed -- 28.3 ft/sec -- he was able to make it up to get there. With a better jump, the dive may not have been necessary, and it might not have made highlight reels.
This all means that we can present seasonal leaderboards for best jump, and also break it down further into the components of "reaction," "burst," and "route." (Note that for seasonal leaderboards, only plays with a 90% Catch Probability or harder will be considered; on "easy" plays, there's often no jump or direct route even required.)
2019 Jump leaders (leaderboard)
+3.0 feet above average -- Kevin Kiermaier, Rays
+2.9 feet above average -- Guillermo Heredia, Rays
+2.0 feet above average -- Leury Garcia, White Sox
+1.9 feet above average -- Robbie Grossman, A's
+1.7 feet above average -- Harrison Bader, Cardinals
+1.7 feet above average -- Jackie Bradley Jr., Red Sox
+1.5 feet above average -- Ender Inciarte, Braves
+1.4 feet above average -- Cody Bellinger, Dodgers
In 2018, Inciarte was first, at +2.9 feet above average, ahead of Bader and Corey Dickerson, who won a Gold Glove last year without impressive speed. In 2017, Dickerson was first overall, at +3.0 feet above average, ahead of Kiermaier and Michael A. Taylor. In 2016, it was Kiermaier at +4.3 feet, just ahead of Inciarte and Jason Heyward.
That's a beautiful list of names for 2019, because they're all very different players. Kiermaier, along with Inciarte, has long been one of our kings of making difficult things look easy, but unlike Inciarte, he has elite speed, ranking in the 97th percentile of Sprint Speed. He's fast to get moving and fast at top speed, just like Bader.
Garcia has long been a utility player, though he's seeing more time in center for the White Sox this year. "He has very good speed," manager Rick Renteria told the Chicago Tribune earlier this month. "His jumps are very good." We'll call that a solid scouting report, skipper.
Grossman isn't that fast -- a slightly above-average 62nd percentile Sprint Speed -- but he makes up for it with great reactions. Count this as yet another thing that Bellinger does well (we encourage you to watch this video of him snagging a 15% Catch Probability play that he makes look incredibly easy, thanks to his excellent +8.2 ft above average jump).
To really get an idea of what this means, compare two 2019 opportunities, nearly identical in composure, to two different Rays center fielders.
On April 17, Kiermaier was given a 15% Catch Probability chance, as he had to cover 51 feet in 3.4 seconds, to his left. On May 19, Heredia also had a 15% Catch Probability chance, as he had to cover 52 feet in 3.4 seconds, to his left. Neither got close to their top running speed. Both balls were hit at over 100 mph by righty hitters, both in games that weren't close at the time. Other than being in different parks, they're about as similar as two chances could be.
As you'll see in the comparison video here, Kiermaier got there, making the catch before leaving his feet. Heredia didn't even come close enough to bother trying. The difference? Kiermaier had an elite jump of +9.3 feet above average. Heredia's was +0.4. That's nine extra feet in the first three seconds, and that's the difference between a great catch and a no-shot single.
Bradley, however, is an interesting case. He's a very good outfielder, and he's got a very good jump. But unlike some of the other names on that leaderboard, who get there by having fast reactions and good routes, he's an absolute extreme. When we break this down into components, you'll see he's fantastic at some things -- and near the bottom at others.
"Jump" is the big-ticket number here, showing feet covered in the right direction in the first three seconds. But why stop there? We'll also show three other components.
• Reaction. Feet covered (in any direction) in the first 1.5 seconds. Think of it like a way to measure first step.
• Burst. Feet covered (in any direction) in the second 1.5 seconds. Think of it like a way to measure acceleration.
• Route. Compares feet covered in any direction to feet covered in the correct direction over the full three seconds.
(Why are we doing this in distance covered, and not time? In part because it makes it easier to include direction, but also because time was unsatisfying; it's not a lot of fun to say that everyone had a first step of 0.2 or 0.3 seconds.)
Let's dig into each one.
REACTION (feet covered in any direction from 0 seconds to 1.5 seconds)
+2.9 feet above average -- Bradley Jr., Red Sox
+1.9 feet above average -- Ramón Laureano, A's
+1.9 feet above average -- Gerardo Parra, Nationals
+1.9 feet above average -- Heredia, Rays
+1.6 feet above average -- Leonys Martín, Indians
Bradley leads the Majors in reaction distance above average in 2019, at +2.8 feet. He led the Majors in it in 2018, at +2.7 feet, just ahead of Inciarte and Carlos Gonzalez. He led the Majors in it in 2017 too, at +3.1 feet, just ahead of the Gonzalezes, Carlos and Marwin. Absolutely no one in baseball gets moving faster than Bradley does.
If it sounds like there's a "but" coming here, there is. This metric measures the most feet covered in any direction. Bradley covers more ground than anyone in the first second-and-a-half, but it's not always in the right direction. There might be a good reason for that, as you'll see below.
By the way, the bottom of this list? Mike Trout, at 2.5 feet below average. There's at least one thing he's not great at, though if you read to the bottom, you'll see there's more to it than this for him.
BURST (feet covered in any direction from 1.6 to 3.0 seconds)
So you've gotten off to a good reaction, or not. You're maybe not quite up to a full sprint yet. Who's accelerating the best between those two points?
+2.1 feet above average -- Kiermaier, Rays
+1.8 feet above average -- Bader, Cardinals
+1.6 feet above average -- Jarrod Dyson, D-backs
+1.5 feet above average -- Heredia, Rays
+1.4 feet above average -- Delino DeShields, Rangers
+1.3 feet above average -- Jake Marisnick, Astros
Bellinger is next on the list here, but unlike any of the other metrics shown, burst does seem to correlate very well to Sprint Speed. All five names here are elite burners, and that was true last year, when Bader, Travis Jankowski and Adam Engel were atop the burst list, and in 2017, when Buxton, Taylor, Kiermaier, Engel and Dyson were the top five.
ROUTE (feet covered compared to direct route, from 0.0 to 3.0 seconds)
+1.2 feet above average -- Andrew Benintendi, Red Sox
+1.0 feet above average -- Ian Desmond, Rockies
+0.9 feet above average -- Andrew McCutchen, Phillies
+0.9 feet above average -- Shin-Soo Choo, Rangers
+0.9 feet above average -- Trout, Angels
+0.9 feet above average -- Kepler, Twins
The first thing you'll notice here is that the range is simply smaller. From top to bottom, we're talking about three feet of difference. That's smaller than the five-to-six feet ranges for reaction and burst. That's easy to explain: Even the worst Major League outfielder is still a Major League outfielder. It's not hard to be slower than Buxton. It's very hard to run in the wrong direction for a sustained time. That said, none of these players have strong reaction times, so it could be a case of a slow start leading to a good route, because you have more time to know where to go.
"It’s definitely with a lot of work, for sure. The best thing for you to do out there is have a direct line to making the catch. You want it to be as straight as possible. When I picture the outfield and the ball coming and me going after it, I try and draw a straight line to where that ball is going to end up and how I’m going to get to it. Try my best to not have any loops in the routes."
In high school, McCutchen was one of the top wide receivers in Florida, an experience he believes played into his route-running.
"Football, being a wide receiver, that’s all you’re doing. All your routes are based on A to B. There are some routes that make you kind of banana out. Those are post routes, etc. But you’re hitting angles. Everything is about an angle. So I do believe playing football and playing angles, working on those, working on routes, I think they have something there. Especially balls overhead when you’re running after them, knowing that the ball is up there and the time that you have, knowing that you can take your eye off the ball, look back up and still find it. I think playing football, I have a bit of an advantage at that."
But: What _is_ a good route? McCutchen is just trying to get there on a straight line.You saw what Inciarte had to say about it above. Cubs manager Joe Maddon concurred, speaking to David Laurila of FanGraphs earlier this year.
“I’m really trying to put an emphasis on the first step. That’s at every position on defense. First move. Everybody always loves the sexy -- watching themselves hit, striking someone out and watching that nice pitch -- but very few times do players have a chance to watch themselves move; that first movement. I try to convince them that the big plays are made on the front part, not the latter part. Your first movement has to be efficient. I want them to understand that what you do at the beginning of the play totally impacts what happens at the conclusion.”
But now we get back to Bradley, who is an elite outfielder with good-not-great speed, best-in-baseball reaction times ... and worst-in-baseball routes. Bradley is 1.5 feet below average in route-running in 2019, was 2.3 feet below average in 2018 and 2.0 feet below average in 2017.
Yet as Bradley told The Athletic last year, this isn't an accident. It's a strategy.
"I say the last few feet are the most important, because that’s when you have to make your small little adjustments," he said. "If you’re thinking about making those adjustments earlier on in the route, then you might not even have the opportunity to catch it because you won’t get back there in time. You’ve got to get there first. Make the adjustments when you need to."
Whether or not that's a good thing is a question for another day -- if and when we introduce a "closing speed" metric perhaps he'll be spectacular at it -- though it does help us learn a little more about why Bradley always seems to be making the spectacular play while Inciarte's are far more muted. It does, however, give us confidence the metric is measuring what we'd like it to be.
Finally: You can find all of this on Baseball Savant's player pages, too. So, when players talk about trying to improve their first steps and reactions, now we can see if that's true.
Last year, you might remember, a big talking point about Trout was that he was attempting to improve his defense by improving his reactions, and then he did. We didn't have this data at the time, but now that we can do, we can look back. What did that look like?
Trout remained slow with reactions, which seems like an issue he's had for years. But he has managed to improve his burst in each season, which, when paired with strong routes, has allowed him to add nearly two feet of jump distance overall. That's real improvement.
Meanwhile, Houston's Springer had gotten off to a massive .308/.389/.643 start before injuring his hamstring in late May. It wasn't just about what he was doing at the plate, however. As he detailed during Spring Training, Springer had dropped 12 pounds in an attempt to add speed and steal more bases.
It showed. Springer's Sprint Speed jumped from 27.7 ft/sec to 28.3 ft/sec, or from the 66th percentile to the 84th percentile. And on defense, there were improvements in both his reaction and his burst, leading to a positive jump for the first time in the four years this data is available.
It remains to be seen whether that will change when he returns from the hamstring injury later this month. For now, you can see what a big deal it's been.
What this allows you to do, really, is verbalize scouting reports. "Kiermaier has elite speed, excellent reactions and burst, and average routes." "Bradley has average speed, the best reactions in the game, and indirect routes." Feel free to come up with your own. The new outfield metrics are available at Baseball Savant.
Mike Petriello is a stats analyst for MLB.com, focusing on Statcast and Baseball Savant, and is also a contributor to MLB Network.

