

The projections do hate your team, Atlanta fans. Here's why.
The Braves are the three-time defending NL East champions, having won nearly 60% of regular-season games in the past three seasons. In 2020, they came within a game of going to the World Series; they have the defending NL Most Valuable Player (Freddie Freeman), one of the most exciting young stars in the sport (Ronald Acuña Jr.), and a talented rotation that added Charlie Morton and has one of 2020's breakout rookie stars (Ian Anderson). Just this past weekend, they also re-signed one of 2020's most fearsome sluggers (Marcell Ozuna).
Surely, based on that recent track record and the talent they still have on their roster, they must be heavily favored to easily win the East again, right? Right? Except: No. Look at how a few major projections have Atlanta coming out.
FanGraphs: 89-73, 2nd place
Baseball Prospectus: 82-80, 4th place
Oh, no.
Braves fans are Big Mad Online about this, and we can't even really blame them. We'd be annoyed, too. Were we doing our own personal eye test, we'd say something like, "Braves and Mets similar at 91 projected wins, Nationals and Phillies near one another around 84 wins, and the Marlins pulling up the rear." Even that probably wouldn't be satisfying, because again: Three straight division titles.
More than that, this isn't the first time. Just look at the past three years, with past season-opening projection totals collected from this site.
• Actual wins total for the Braves in 2018, '19, and '20: 90, 97, and 35.
• PECOTA projected wins in 2018, '19, and '20: 76, 85, and 31.
• FanGraphs projected wins in 2018, '19, and '20: 72, 84, and 33.
Not great! It's a recurring theme. Projections are not predictions, to be sure, and no system can see perfectly into the future. Sometimes, remember, they're shocking, and then they're right. In 2019, PECOTA projected the Cubs, who had just won 95 games and made the playoffs for the fourth year in a row, to go 80-82. Cubs players were furious, and it looked bad when they were 10 games over .500 on May 19. They then played losing baseball the rest of the year, and finished at 84-78. More famously, it projected the 2007 White Sox (who had won the World Series in 2005 and won 90 games in 2006) to go 72-90. They went 72-90.
Sometimes they're wrong, too. In 2015, PECOTA projected the Royals to go 71-91. They won the World Series. In 2016, PECOTA projected the Orioles to go 73-89; they actually went 89-73 and made the Wild Card game. In 2018, then-FanGraphs writer Jeff Sullivan looked into the past 15 years of projections, and he found exactly what you'd expect: There's overall a pretty decent relationship between projected wins and actual wins, and also there are wide error bars and some stark outliers.
So, let's try to dig into the way projections work, focusing on Atlanta. Can we see the arguments here, and why they might be viewed so low? Put another way: Here's why projections hate your team.
Because previous player stats matter, but previous team standings don't
This is the number one thing you'll hear: But the Braves keep winning divisions! The Mets have been third or lower for the past four seasons! That's all true. It also doesn't matter at all for 2021.
That is, primarily, because rosters aren't static. The 2018 Braves team that won 90 games, for example, gave 141 starts to six pitchers who won't have any role to play in the 2021 Atlanta season (Mike Foltynewicz, Julio Teheran, Sean Newcomb, Aníbal Sánchez, Brandon McCarthy and Kevin Gausman). Nick Markakis got 705 plate appearances. The primary relievers were Arodys Vizcaíno, Jesse Biddle, A.J. Minter, Dan Winkler, Sam Freeman, and Shane Carle. Only Minter is going to have anything to do with Atlanta in 2021. Projection systems project players, not uniforms.
Meanwhile, the 2021 Mets will have Francisco Lindor, Marcus Stroman, Trevor May, Carlos Carrasco, James McCann and Albert Almora, Jr., which the 2020 team did not. It matters a little what those players did in 2018, though less so as time goes on, because any good projection weighs more recent performance more highly. It doesn't matter at all what the Mets did in 2018, because most of those players aren't around anymore, nor is the owner, general manager, or field manager.
At their heart, projection systems are basically "player projections for the upcoming season" x "playing time projections for those players on their team's roster." That's largely oversimplifying -- age and other factors are included -- but it's very much a looking ahead rather than a looking back. (It's also about "the players you have on your roster," and not "just the ones you got this winter." Looking at you, White Sox, Padres and Cardinals fans.)
So: "the Mets will have Francisco Lindor" matters a lot more than "the Braves won the division three times in a row."
Because projections aren't just "repeat the previous year again."
Recency bias is a powerful thing. Let's talk about a trio of Braves who were absolutely spectacular in the shortened 2020 season -- Freeman, Ozuna and Anderson.
For the first decade of Freeman's career, he was outstanding. In over 5,700 plate appearances through 2019, he had a 137 Weighted Runs Created Plus, or wRC+, where 100 is league-average. In 262 plate appearances in 2020, he was wildly better than that, with a 187 wRC+.
While we're buying that's not entirely a fluke -- his comments about his elbow health stood out -- that represents 4.5% of his career total. So if you were to look at the numerous projection systems on his FanGraphs page, they're variously 136 to 148, which is still excellent, but not a straight repeat of two hot months. (Baseball Prospectus' version, DRC+, has a similar projection of 146.) It's fair to expect he'll be great, but not as great.
It's the same thing for Ozuna. His first seven seasons, nearly 4,000 plate appearances: 112 wRC+. His 267 outstanding times to the plate in 2020? A 179 wRC+. His 2021 projections? In the 125-130 range.
"A bunch of players had monster years in a shortened season for [Atlanta] last year," said Craig Goldstein, editor-in-chief of Baseball Prospectus, which publishes the PECOTA projections. "PECOTA expects Freeman and Ozuna to remain very good -- but not as good as last year."
Anderson, meanwhile, made 10 starts, combining the regular season and the postseason. In 51 total innings, he allowed nine earned runs (and a mere one home run), which would be a 1.59 ERA. We like Anderson very much, and he proved quite a bit in his debut. And yet unless he is the greatest pitcher of all time -- note: he is not the greatest pitcher of all time -- he will not be as good as that in 2021. He will be worse.
Anderson is projected for a 3.95 ERA (PECOTA), 4.15 ERA (ZiPS), and 4.48 ERA (Steamer). We think those are too high. We think he's better than that. We do not think he's a 1.59 ERA pitcher, because no one really is.
This is more projection-specific than Braves-specific, really, and it works both ways. Anthony Rizzo had a 134 wRC+ in 5,020 plate appearances as a Cub before a disappointing 103 wRC+ season in 2020. His 2021 projections: Around 125.
It's just how these things work. It's not about the Braves. But ... what if it is?
Because maybe there's been something specific about the Braves
This is possible, though not in a "hate your team" sort of way. Much of the time, a good- or bad-looking single-year projection is due to an out-of-nowhere career year, or catastrophic injury luck, or something unpredictable and non-systemic. But not always. The most famous over-performers of the projection era are probably the 2012-'17 Orioles, who consistently won more than they were estimated to. In their case, there was a reason, and it was their dominant bullpen. As Sam Miller wrote at ESPN in 2017:
"PECOTA has never thought the Orioles were particularly good. In a sense, it hasn't been that far off. The offense has been what it expected. The starters have been what it expected. The bullpen has been very good, but bullpens are inherently unpredictable, and it's probably prudent to avoid projecting any bullpen will carry a mediocre team to the playoffs."
That was especially true about the 2012 Orioles, which had a 29-9 record in one-run games, the best mark in Major League history. That's a good way to win ballgames above your talent level, but it's not an inherently repeatable skill; the next year, they were 20-31 in one-run games.
Let's repeat Miller's work and see if we can figure out where, if anywhere, the Braves have overperformed the FanGraphs projections.
It got the pitching mostly right
Over the past three seasons, FanGraphs projected the Braves would allow 1,733 runs. They've actually allowed 1,688 runs. That's actually really good -- a mere 15 runs per season! -- if not exactly consistent, as Braves pitching did better in 2018 than expected and worse in 2019 and '20. Still, score one for the projections.
It's consistently low on the hitting
In 2018, FanGraphs projected the Braves to score 698 runs. They scored 759, an extra 61. In 2019, Atlanta scored 121 more runs than projected. In 2020 it was 85, and remember, that season was 37% as long. Over the past three years, the Braves have scored 267 more runs than projected.
It's worth noting that the Braves have had a new ballpark since 2017, and maybe park factors have been slow to catch up. It could be a little bit of that, but it can't be entirely that. Is it all unpredictable performances?
In 2020, as we noted, Freeman and Ozuna wildly outdid anything they'd done to that point; so did catcher Travis d'Arnaud, and few expected 15 homers from Adam Duvall. In 2018, it seems more situational; the Braves had an .812 OPS with runners in scoring position, but a mere .742 in all other situations.
This doesn't mean the same will happen in 2021, but looking at what the offense does is a good place to start.
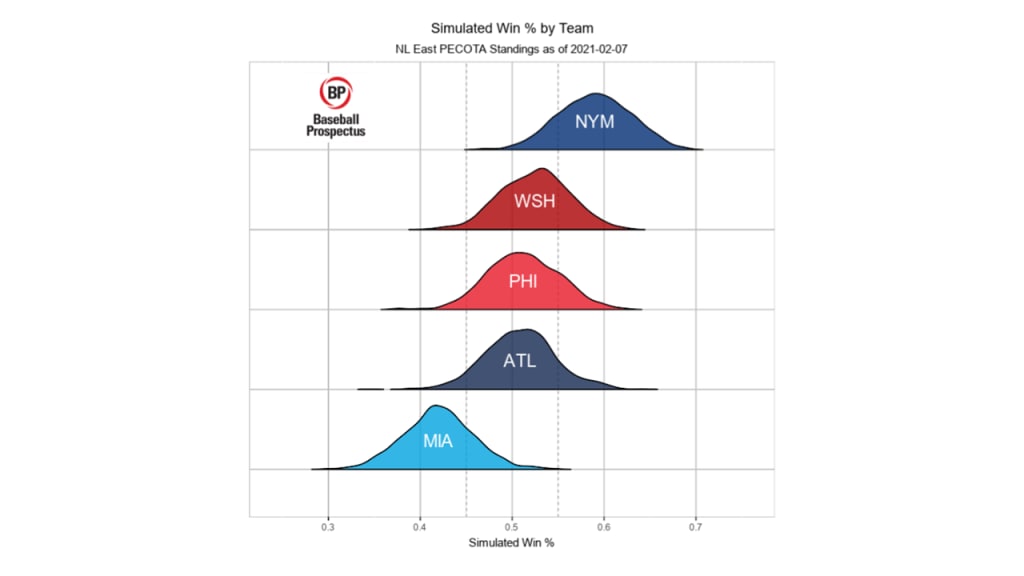
Because the actual win number is less important than the spread.
It's easy to focus on the outcome number -- they're going to win 82 games! -- and move on, but that's also not really how it works. Projection systems don't just spit out one number. They run thousands (or more, depending on the system) of simulations of the season. Sometimes, those fictional Freddie Freemans give you a mere .241/.342/.431 line (his 10th-percentile, near worst-case PECOTA projection). Sometimes they give you a .323/.442/.609 (his 90th-percentile, it's-all-going-great projection). And sometimes, they get hurt, and 80% of the playing time goes to, let's say, Pablo Sandoval.
There are a lot of different timelines that are possible. There are versions of this where they win 100 games, and versions where they win 60. The average number in all of those projections is around 82, but it's not The One True Number. You can see that in these 2021 projection distributions. Draw a vertical line, and you can find the version of the timeline you like the best.
Because there are some actually valid reasons to see weakness in the Braves
We saved this for the end, but it's probably the most important part. Like all teams, the Braves have some areas you can point to and ask questions about.
Start with the rotation, which could be very good. Or not. We noted Anderson's status above, but look also at Morton, projected by PECOTA for 137 innings of 3.67 ERA ball. That's disappointing if you saw the Houston version who averaged 170 innings at 3.24; then again, he is 37 years old and last year missed time with a shoulder injury. Drew Smyly had been hurt and/or ineffective for years before a good September earned him $11 million; your guess for his 2021 is as good as anyone else's.
Max Fried's 2020 (2.25 ERA) was so good that it earned him Cy Young votes. His 3.99 PECOTA projection was so disappointing that Goldstein wrote an entire article just about it, noting accurately that despite his ERA dropping from 4.02 to 2.25 from 2019-'20, he did that as his strikeout rate dropped, walk rate got higher, and home run rate got worse, which is a difficult trick to pull, much less sustsain.
Then there's Mike Soroka, one of 2019's biggest breakout stars, posting a 2.68 ERA in 174 2/3 innings and collecting Cy Young votes of his own. He's projected for a 4.07 ERA in 2021. Why?
"Most projection systems are wary of Soroka because he doesn’t miss bats like the other elite pitchers in this era," wrote Goldstein, which is true. In his very good 2019, Soroka's 20.3% strikeout rate was 45th of qualified starters, similar to Merrill Kelly and Wade Miley. Forget projections for a second; even in the moment, ERA estimators weren't totally buying that 2.25. BP's DRA called it a 3.24 kind of year; Statcast's xERA was even less favorable, at 4.12. That's all before the Achilles injury from which he's returning.
You can do the same thing in the bullpen, and on offense. Last year, they got 66 2/3 innings of 2.30 ERA ball from Darren O'Day, Shane Greene and Mark Melancon; each have signed elsewhere or are free agents. Center fielder Cristian Pache is expected to be a fantastic fielder, but every projection system has him considerably below-average with the bat, perhaps not unfair for a 22-year-old with a career .331 Minor League OBP.
There's a ton of talent here, without question. There's maybe a little less depth, and there are a few more questions, than you might think.
Because the number really, really feels low
Now that you know how the projections actually work, and what they're taking into account, it's still pretty OK to come away from this with: No. No, we do not accept this. Which is fine -- as we said above, we agree. This feels light. Really light. As we said above, this feels more like a 90-91-ish-win team. Projections may not care about three straight division titles, but those flags get raised in the ballpark. Even the people who help create the projections don't always have to buy them, 100%, fully.
"It feels five or so wins light to me on Atlanta," said Goldstein, "and a comparable amount heavy on the Mets."
Knock five wins off the Mets, add five to Atlanta, and you get something a lot closer than a tie. You can't just do that, of course; it wouldn't be much of a projection system if a human just put their thumbs on the scale. That's why projections are a starting point, not the end of the story. Unless, of course, they're dead on.