What Statcast tells us about catchers and stolen bases
This browser does not support the video element.
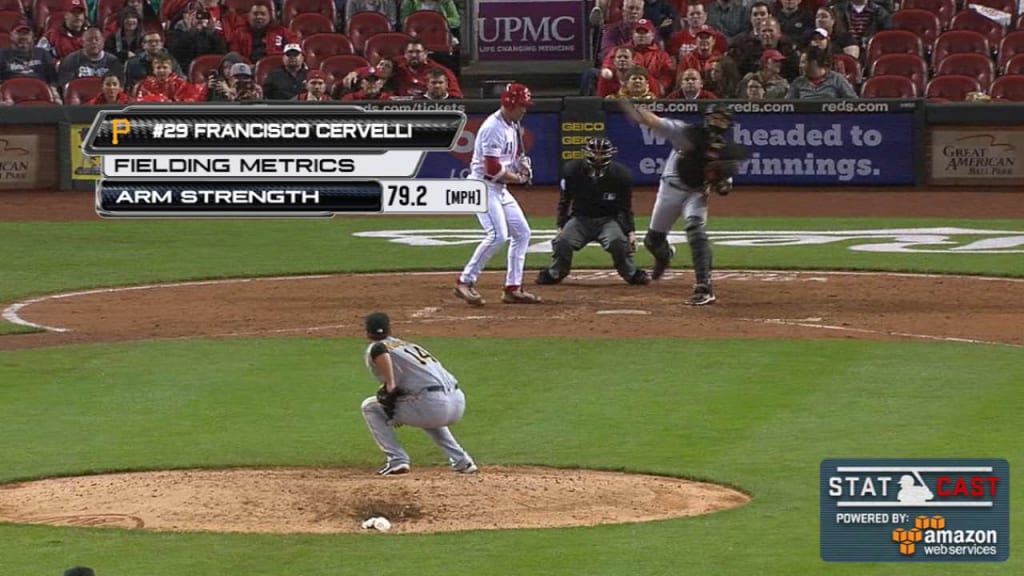
On May 9 in Cincinnati, we saw what may have been the least likely caught stealing of the season. In the eighth inning of a game the Pirates would go on to lose, 3-2, Pittsburgh catcher Francisco Cervelli accomplished the near-unthinkable: He nailed Billy Hamilton trying to steal second base.
We say that because Hamilton is regarded as baseball's pre-eminent basestealer and because Cervelli has been victimized more than any other recent catcher. Since the start of 2015, Hamilton has swiped 115 bags in 131 attempts, making for an outstanding 87.8 percent success rate that's the highest in baseball among the 77 runners with 30 steal attempts in that span. Meanwhile, no catcher has allowed more stolen bases over the same time than Cervelli's 168 -- all the more remarkable because he wasn't even on the field for large chunks of time in 2016 due to a variety of injuries.
On paper, it was just about as big of a mismatch as you can get. Dancing off of first base with a 1-1 count to Joey Votto, Hamilton took off. The pitch, measured by Statcast™ as an 87.1 mph slider from Ryan Vogelsong, was slightly inside, and the throw from Cervelli to shortstop was on target.
"Got him! What a throw by Cervelli… _wow!_" exclaimed the Cincinnati broadcasters, certainly unaccustomed to seeing Hamilton get thrown out.
The throw's velocity was measured as being 79.2 mph. Is that why he caught Hamilton? Is that even _good? _
* * * * * *
To answer the second question, we need to be able to look at large samples of catcher throws from across the Major Leagues in order to have data to compare Cervelli's throw to, and we'd never been able to do that prior to 2015, when Statcast™ came online.
Before that, we oversimplified. We judged the quality of catchers based largely on caught-stealing percentage, even though we know that in reality the path to "safe" or "out" on each attempt is really an intersection between a variety of events controlled in part by the pitcher, catcher, runner and even the infielder.
This browser does not support the video element.
Let's focus on just one of those skill sets: arm strength. Using Statcast™ data, we looked at 1,701 tracked catcher throws to second base on steal attempts from the 2016 season, which broke down into 1,151 successful steals and 550 outs.
The number of tracked throws isn't close to being equal to the total number of steal attempts of second base, but it's not expected to be, either, because not every steal attempt draws a throw. Think of how many times a catcher doesn't catch a ball cleanly and doesn't bother with a throw, or throws to third rather than second on a double steal.
It's more than enough data for a reasonable sample size, so we'll use it and start with a simple question: Is there a relationship between average arm strength and caught-stealing percentage? Yes. Sort of.
What you see here are the 59 catchers with 10 or more tracked throws to second on steal attempts in 2016, and there's unquestionably some relationship there, though there's a pretty wide distribution around that trendline, too.
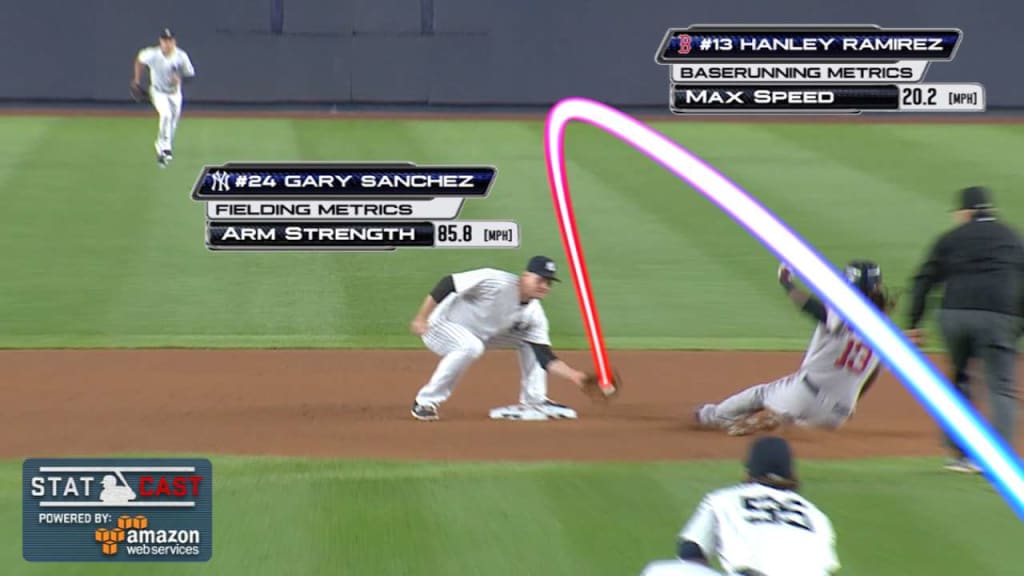
Points in favor of "yes, it matters" would be that the lowest caught-stealing percentage belongs to Tyler Flowers, who has a weak arm, while one of the highest is Gary Sánchez and his strong arm. Points in opposition would include the fact that Russell Martin and Salvador Perez had similar arm strengths (80.9 mph for Martin, 81.2 mph for Perez), yet had wildly differing success rate (15 percent for Martin, 48 percent for Perez).
At the very least, we can say that it's hard to be very good with a poor arm, and that you're unlikely to be terrible with a strong arm, but there's still a lot of noise in the middle. Particularly in the 20-30 percent range of successful caught stealings, we see arm strength differences of more than 10 miles per hour. Clearly there's more going on here than just hard throws.
So we see somewhat of a relationship, but it's not a satisfying one. Instead of average_, what does the _distribution of catcher throws look like, by outcome?
As you can see, this is a pretty normal distribution, which isn't unexpected -- 65.6 percent (two-thirds, basically) fall in a band between 76-81 mph, and 48.5 percent (about half) come in the tighter area between 77-80 mph. When anecdotal evidence started piling up around the Statcast™ labs this season that most throws always seemed to be between 76-81 mph, regardless of success, this is what we expected to see.
So far, we've seen that it helps to have a stronger arm, but also that it doesn't guarantee success, and that the spread between "weak" and "strong," outliers aside, doesn't seem to be that large. In addition, the overall Major League average when looking at successes or fails doesn't show much difference:
Average catcher arm strength on stolen bases at second base: 78.8 mph
Average catcher arm strength on caught stealings at second base: 80.1 mph
That's a difference of barely over one mile per hour. Let's convert miles per hour into seconds, and see how long throws take in the air. The average "throw time" (which is the time elapsed from the catcher's release to the time the infielder receives the throw) on stolen bases at second is 1.26 seconds. The average "throw time" for caught stealings is … 1.24 seconds. That's two-hundredths of a second, which doesn't seem like all that much.
Maybe, however, this is a failure of "average," where catchers perhaps aren't consistent, or where outliers can skew things, so let's look at it another way. Instead of distribution, what if we look at the success or fail rates for MPH buckets, from low to high?
Now we're getting somewhere. We see that 82 mph is a very important point for success, and maybe that's where it pays to start caring about a catcher's arm strength. To that end, we noted earlier that two-thirds of our throws fell between 76-81 mph, and separately we're seeing that 82 mph seems to be an important line. What if we broke it down into what happens when throws are in that primary band, as compared to throws above and below?
Perhaps this is the purest view. Above, we showed a decent relationship between arm strength and caught-stealing success, but looking at the averages for catchers allows for dozens of potential inputs without regard for frequency. This puts the relationship between throwing arm and caught-stealing success on an individual basis, and it certainly seems stronger than expected -- particularly at 82 mph and above.
Cervelli didn't hit 82, however. His was 79.2, remember. But let's go back to that play, and answer the question we originally posed. The 79.2 mph throw he unleashed was just about at the Major League average. So if Cervelli's arm strength wasn't all that notable in the play, what did he do -- or, perhaps, what did others do -- to help turn the outcome into an out?
It's not that Hamilton wasn't running quickly; he made it from first to second base in 3.68 seconds -- better than the average times in our sample both for successful steals (3.78) and failed steals (3.91). It's not that Hamilton had a poor lead, not really. At the time Vogelsong released the pitch, Hamilton was 21.1 feet off the base, meaning he cut 90 feet down to just under 70 feet. That's better than the usual average for failed steals (20.4 feet), yet below the average for successful steals (23.1 feet), though Hamilton's elite speed should compensate for that somewhat, and he'd swiped bags with leads as low as 18 feet.
Nor is it that the pitch was so fast that it gave the catcher a head start, either. As we noted above, an 87.1 mph pitch doesn't stand out, and pitch velocity doesn't seem to have any correlation whatsoever between successful steals (89.3 mph) and failed steals (89.2 mph). It wasn't that Vogelsong was particularly quick to the plate, either, with a 1.10 second release time that's right in between the averages for successful steals (1.13) and times caught (1.08).
But there were a few things that stood out. Most notably, while Cervelli's throw wasn't necessarily _strong_, it was _accurate_, nearly perfectly so, as you can see by this frame of the play just a split-second before Mercer received the ball. He merely had to drop his hand slightly and allow the runner to slide right into the out.
Second, Cervelli did an outstanding job of getting rid of the ball quickly. Overall, Cervelli was a somewhat below-average catcher in terms of exchange time, tying for 35th with a 0.75 second mark, where the range goes from 0.64 (David Ross) to 0.88 (Jarrod Saltalamacchia). The Major League average for exchange time on steal attempts at second base was 0.73, so while we're not talking about huge numbers here, every fraction counts.
On this play, however, Cervelli came in at a scorching 0.57 seconds. It was his third-fastest time of the season, and best on a successful caught stealing. Interestingly enough, the first two times both came against Milwaukee's Keon Broxton, who stole 23 times in 27 attempts in his rookie season, and had speed so elite that he had the sixth-fastest home-to-third time measured by a righty hitter on a triple this year, behind four from Byron Buxton and one from Manuel Margot.
So it seems easily possible, if not probable, that Cervelli was well aware of the speed on the bases and put extra emphasis on getting the ball out quickly and was able to throw out baseball's reigning basestealing king.
You can see how much more work remains, of course. Once correlations are run against all of the various inputs that go into "safe" or "out," we'll have a much better idea of how much credit or blame is due to each party. Instead of just how much lead distance a runner had when the pitcher threw the ball, we'll be able to push deeper and see just where he was when the catcher caught and released the ball, too.
It's "good" to have a strong arm for a catcher, and while that perhaps seemed obvious, it's nice to have some empirical evidence around it. It's just one of a ton of different things that go into it. You probably already knew not to judge a catcher based on "caught-stealing percentage" alone. Now, you know where and how arm strength starts to make a difference.
A version of this article first appeared in the 2017 Hardball Times Annual.

